SOURCE:
Service categories where CPI fell year-over-year:
SOURCE:


| Services, where prices rose YoY | MoM | YoY |
| Health insurance | 2.1% | 28.2% |
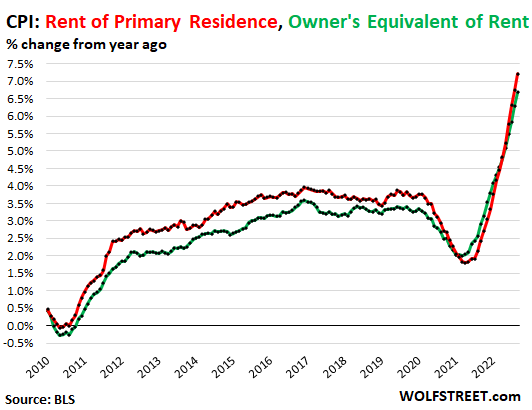
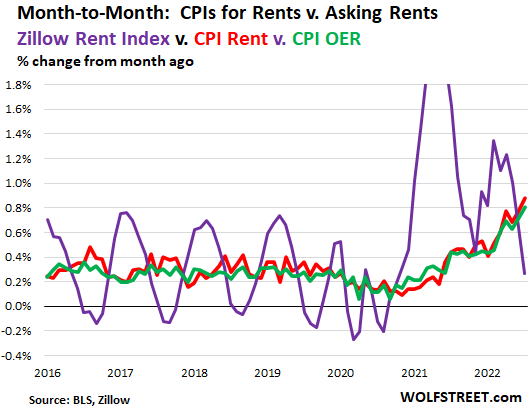
| Rent of primary residence | 0.8% | 7.2% |
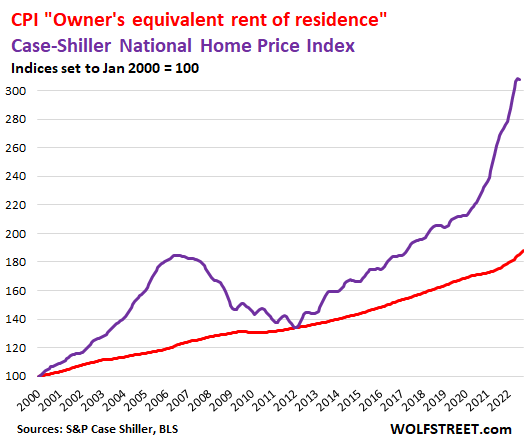
| Owner’s equivalent of rent | 0.8% | 6.7% |
| Motor vehicle insurance | 1.6% | 10.3% |
| Motor vehicle maintenance & repair | 1.9% | 11.1% |
| Medical care services | 1.0% | 6.5% |
| Delivery services | 2.9% | 16.4% |
| Pet services, including veterinary | 1.6% | 11.0% |
| Airline fares | 0.8% | 42.9% |
| Hotels & motels | -1.2% | 3.1% |
| Other personal services, such as dry-cleaning, haircuts, legal services | 0.3% | 5.9% |
| Admission to movies, theaters, concerts | -1.3% | 0.4% |
| Video and audio services, cable | -0.4% | 2.5% |
| Water, sewer, trash collection services | 0.7% | 4.9% |
| Services where prices fell YoY | MoM | YoY |
| Telephone services | 0.0% | -0.3% |
| Car and truck rental | 2.5% | -1.4% |
| Admission to sporting events | -2.9% | -9.5% |


| Food inflation | MoM | YoY |
| Cereals and cereal products | 0.9% | 16.2% |
| Beef and veal | -0.1% | -1.1% |
| Pork | 1.8% | 6.7% |
| Poultry | 0.6% | 17.2% |
| Fish and seafood | 0.5% | 8.0% |
| Eggs | -3.5% | 30.5% |
| Dairy and related products | 0.3% | 15.9% |
| Fresh fruits | 0.7% | 8.2% |
| Fresh vegetables | 2.4% | 9.2% |
| Juices and nonalcoholic drinks | 1.2% | 12.7% |
| Coffee | 0.1% | 15.7% |
| Fats and oils | 1.9% | 21.5% |
| Baby food | 1.5% | 11.8% |
| Alcoholic beverages at home | -0.4% | 2.9% |

| Energy | MoM | YoY |
| Overall Energy CPI | -2.1% | 19.8% |
| Gasoline | -4.9% | 18.2% |
| Utility natural gas to home | 2.9% | 33.1% |
| Electricity service | 0.4% | 15.5% |
| Heating oil, propane, kerosene, firewood | -2.8% | 39.9% |


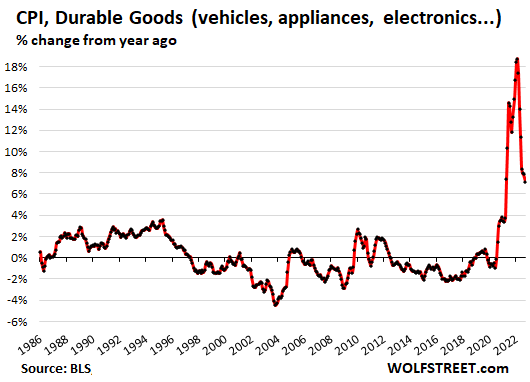
| Durable goods | MoM | YoY |
| New vehicles | 0.7% | 9.4% |
| Used vehicles | -1.1% | 7.2% |
| Household furnishings (furniture, appliances, floor coverings, tools) | 0.6% | 9.9% |
| Sporting goods (bicycles, equipment, etc.) | 3.0% | -1.1% |
| Information technology (computers, smartphones, etc.) | -0.6% | -10.0% |

No comments:
Post a Comment
Note: Only a member of this blog may post a comment.