SOURCE:
Global asset markets -- of all stripes and with few exceptions -- had been routed over recent weeks. In the doing, the risk ante has been upped, and one could be excused for having the sensation that financial history is being written -- said better, rewritten.
When stripped down to its base elements, one central issue is a set of worsening tensions between the markets and governments (the dynamic has been particularly acute outside the US; more on this below).
In this context, you can argue that recent price action marks a clear rejection of the policies that dominated the post-GFC period -- and, were overwhelmingly deployed in the COVID era -- on both the fiscal and the monetary side.
Said another way: the macro complex is punishing a lack of discipline, be it on behalf of policy makers or speculators.
Alongside this event-driven path is the backdrop of a more trend-like and ongoing challenge: the Fed holds the hammer and they continue to aggressively tighten financial conditions.
The job of a trader, of course, is to weigh this ongoing corrosion of the fundamental outlook and the cocktail of risk against the vivid markings of a stock market that is both technically oversold and tactically under-owned.
In some rough order of importance, here’s an attempt to check down the big issues of the day:
1-a. If the Japan intervention story from last week is perplexing, the UK experience is halting: an unexpected, pro-growth budget plan is met with utter carnage in the rates and currency markets, forcing a central bank to aggressively hike into the specter of a deep recession.
To give context to the friction of this process, note that from the lows of August to the highs of September, the yield on 30-year Gilts more than doubled. ... only to drop an eye-popping 105 bps.
In a broader context, I’ll paraphrase a smart observation by GMD colleague Abel Elizalde: over the past 20 years, when allowed to do so, governments and central banks went for the easy option -- be it expansionary fiscal policy or monetary easing.
Well, high inflation changes the “when allowed to do so” component, which means that both the constraints and the reaction function of those governments and central banks have changed.
1-b. Despite today’s move, the “UK-as-EM” jab is perhaps a bit trite by now, while also unfair to certain segments of the EM complex who were early and responsible in this cycle (e.g. parts of Lat Am).
From here, Goldman expects the BOE to hike 100 bps in both November and December, with a terminal rate of 5%.
1-c. I continue to believe the US is the world’s cleanest dirty shirt. This is not an overly original idea -- the dollar index is trading at levels not seen since 2002, or witness specific moves like USD/CNH (from 6.75 at the start of August to over 7.15 today).
At the same time, however, the US is by no means exempt from this rejection-of-policy theme.
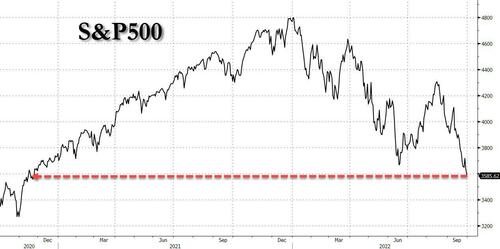
One independent example: S&P is trading below where it closed on the day of President Biden’s inauguration ... despite the fact that, since that date, we have printed ~ $1.7tr of QE ... in addition to ~ $3.5tr of extra fiscal spending that has been passed (of that, ~ $1.7tr has been spent).
2. Coming off the largest weekly rally since the bad old days of March 2020, and today’s retracement aside, perhaps it’s no mystery why the dollar is so strong: the Fed is outgunning their peer group, the market is granting them credibility, and there aren’t many high quality destinations for your capital these days.
That said, I worry we’ve approached the point in the sequence where the dollar’s surge becomes a vicious circle, as it siphons off global liquidity in the doing.
In recent history, there were manifestations of this “our currency, your problem” dynamic in late 2015 and mid-2018 (note the current dollar rip makes those episodes look quaint in comparison.)
This only underscores my broad instinct to be wary of most non-dollar markets, and particularly concerned about China. Also note how this is manifesting as a problem in the commodities space: link.
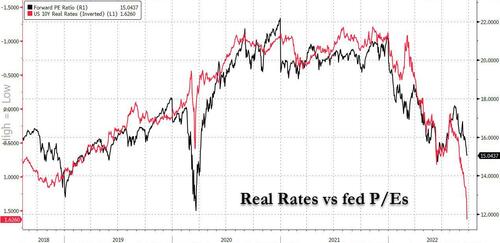
3. A few weeks ago, I showed the overlay of US rates with the S&P multiple.
At that time, stocks appeared optimistically disconnected from the bond market. In the time since, some "catching down” of P/E has played out (this is also clear in NDX, which before today had seen one of its absolute worst 1-month stretches since the tech bubble collapsed).
Until noted otherwise, I’m going to assume the bond market is still the heavy and is largely the arbiter of short-term stock prices.
That hostage dynamic may well shift come the onslaught of Q3 earnings -- again, the reporting season for Q2 provided much needed ballast to the equity market -- while noting that we’re still three weeks out from the bulk of the announcement.
4. The Dutch just proposed to raise the national minimum wage by 10%. The US just re-rated wages for rail workers by 24%.
You don’t need me to tell you that a wage price spiral is afoot, but this is particularly relevant in the US, where over 70% of inflation comes from the services side of the equation.
On this topic, a very thorough note from Goldman's US Economics on where we go from here (available to pro subs): spoiler alert: this is not pleasant reading for the bulls ... considering that both wage and healthcare inflation are still very hot.
5. As mentioned before, there’s been no better Sharpe Ratio on planet Earth this year than short the front end of US Fixed Income.
At some point, one does need to wonder if the position has much gas left in this tank, particularly if market participants need to seriously contemplate a higher probability of a hard landing.
Although point #4 leads me to think the terminal funds rate can continue to lurch higher, such that we haven’t seen the peak in rates, I acknowledge that risk/reward in the front end specifically is far lower today than it was 3/6/9/12 months ago.
Today saw a tentative break of the recent fever, and all of this would lead me to shift your shorts further along the curve.
6. A this point in the note, for the sake of balance, I will register that part of the oddity of the post-pandemic cycle is squaring all of these legitimate fundamental worries against an incontrovertible fact: alongside a very strong industrial cycle, the US has created 5.8 million jobs in the past 12 months.
Furthermore, we’ve created 22.2 jobs since April of 2020 ... aka 28 months ... in contrast to the 119 months it took to recover the same number of jobs post-GFC (thanks Manuel Abecasis).
While that undoubtedly supports the wage inflation challenges, I also mention this as an ongoing bulwark for the US growth outlook.
7. Japan: the last bastion of negative bond yields. On one hand, still the world’s third largest economy with huge linkage to the global cycle.
On the other hand, the BOJ seems to exist on its own planet, buying ever more bonds with CPI at 30-year highs. To add further tension to the mix, last week brought intervention in the currency market just hours after dovish Kuroda commentary.
A quick history lesson from senior GMD colleague Jaewon Yu: “back in 1998, it took several rounds of interventions and a Russian default/LTCM debacle for USD/JPY to sustainably sell off.
This time, we do need a change in Japan monetary policy for it to do the same. Without that, it would continue to be at the mercy of US rates which seems to be showing no sign of stopping in terms of making new highs in yields.”
8. On the topic of how the financial ecosystem is changing in response to higher rates, the stock loan market now offers positive carry on your GC equity shorts (economically, not just metaphorically).
It’s been over a decade since this was a reality and harkens back to the early aughts when hedge funds could harvest a respectable carry via short rebate.
9-a. It’s very clear that measures of sentiment and positioning have reached extremely defensive levels.
My mosaic includes AAII bulls/bears (the most negative since 2009),
CNN fear/greed (current reading = extreme fear),
GS Prime Brokerage data (aggregate long/short ratio = zero percentile on a 5-year lookback window)
and option market activity (last week saw the largest put volume in history -- witness OPCVTOTP --
and think about that relative to the call option bonanza that dominated the entire market in both 2020 and 2021).
Suffice it to say, the trading community has gotten sufficiently bearish.
That said, note the market’s largest sponsor -- US corporates -- are limited until the core of the aforementioned reporting period, while retail and non-discretionary funds largely remain on the offer.
9-b. It’s worth spending a minute on the US retail investor. yes, they have been a net seller over recent months -- but, as has been the case all year, the dollar amount has been relatively modest in the context of (a) last year’s binge and (b) this year’s damage, witness a 40% collapse in the basket of retail favorites. In trying to work out why the selling hasn’t been more significant, my guess is this: the US unemployment rate is 3.7%.
When one remains confident in their job prospects, perhaps their propensity to hit the “sell” button is much lower than it would be in a worse scenario. This is where 2022 has been very different from the post-GFC investor exodus.
9-c. To sum up the positioning story: I believe we’ve seen genuine capitulation in the hedge fund community. On the other side of the coin, US households are still quite full of length.
From here to late October, the buyback support is very constrained. Put that all in a blender, and I’d argue flow-of-funds is net negative for now, with a more positive bias out a month.
Along the way, there will be huge attention paid to the CTA crowd ... I’m increasingly of the view we over-estimate their footprint, but that’s a story for another day.
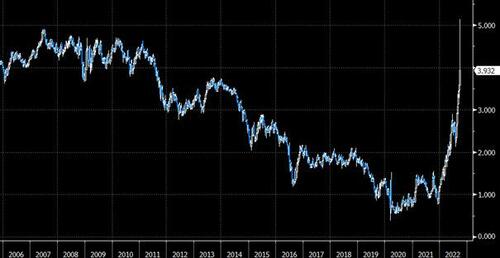
10-a. Two charts to conclude, and they are not for the faint of heart. this a simple plot of yields on 30-year UK government debt.
Note this candle chart accounts for the BOE’s “whatever scale is necessary” moment, which provoked one of the more extraordinary moves I’ve ever witnessed in a developed market (I repeat: 105 bps).
Enter Dominic Wilson: “even with the BoE intervening in the Gilt market, that policy was almost always deployed in times where you wanted to ease policy.
Now it’s running counter to their QT program ... so it’s going to raise all sorts of issues that wouldn’t have been raised in the low-inflation era.”
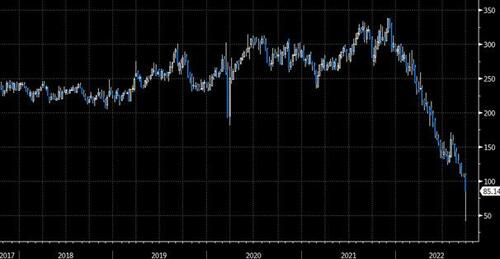
10-b. Same sensation, also a candle chart, but from a different angle ... the price of long-dated (2068 maturity), inflation-linked UK Gilts:


No comments:
Post a Comment
Note: Only a member of this blog may post a comment.