SOURCE:
Big drops in San Diego, Los Angeles, Dallas, Portland, Phoenix, Boston. Prices going down faster than they’d spiked? No way.
This is the first month in this cycle that the S&P CoreLogic Case-Shiller Home Price Index, which lags reality on the ground by 4-6 months, is showing house price declines in all the metros in the index.
In Seattle, the month-to-month plunge was the steepest on record (-3.8%). In San Francisco, the month-to-month plunge (-4.3%) was the third-steepest on record, outdone only by the two worst months during Housing Bust 1 in 2008. In San Diego (-2.8%), Los Angeles (-2.3%),
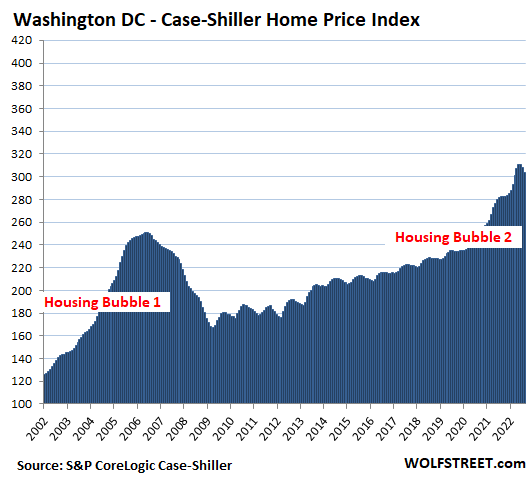
Phoenix (-2.1%), and other metros, the plunges were the worst since Housing Bust 1. And the declines are spreading across the country to other metros, including Dallas, Boston, Washington D.C., and Las Vegas.
These are serious declines for the Case-Shiller Home Price Index, where each month is a rolling three-month average which irons out the month-to-month variability.
Today’s release of the index was for “August,” which consists of the three-month average of closed home sales that were entered into public records in June, July, and August. Due to the delay between when a deal is made and when the “closed sale” is entered into public records, the time span for “August” roughly covers deals made in May through June. During that time, the average 30-year fixed mortgage rate reached the 6% range. Today, we’re at 7%, and mortgage bankers are frazzled.
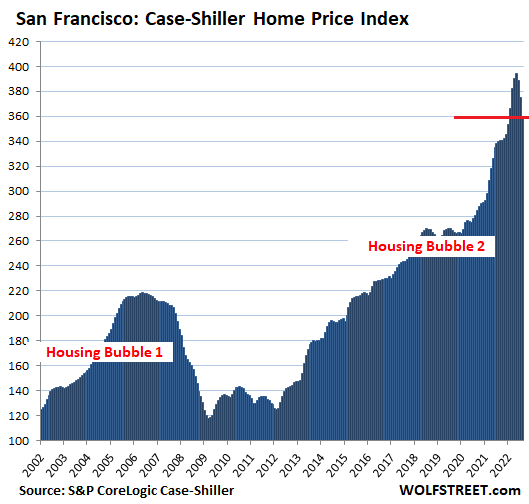
In the San Francisco Bay Area, house prices plunged 4.3% in “August” (three month moving average of June, July, and August) from July, the third-steepest plunge on record, outdone only by the two slightly steeper plunges during the depth of Housing Bust 1 in 2008. The plunge in August was an acceleration of the drops in July (-3.5%) and June (-1.3%).
The index has dropped 8.9% from the peak. Over those three months, the index plunged faster (-35 points) than prices had spiked during the last three months of the spike (+27 points). House prices going down faster than they’d spiked? No way, impossible. Oops.
This turn of events slashed the year-over-year gain to +5.6%, from +24% earlier this year, unwinding so far just the final stages of the ridiculous spike over the past two years. The index is now at the lowest level since January.
The Case Shiller Index for “San Francisco” covers five-counties of the nine-county San Francisco Bay Area: San Francisco, part of Silicon Valley, part of the East Bay, and part of the North Bay.
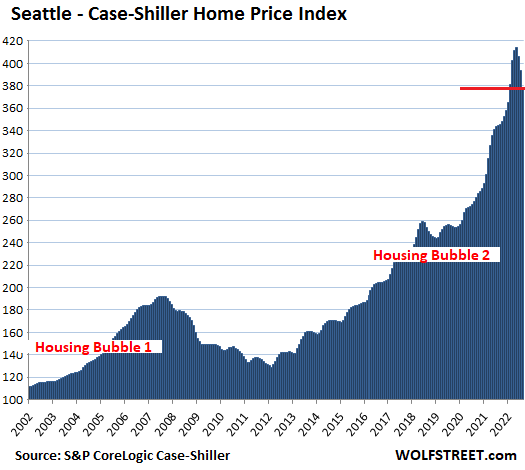
In the Seattle metro, house prices plunged 3.9% in August, the biggest month-to-month plunge on record, on top of the 3.1% plunge in July, and the 1.9% drop in June. The index has dropped 8.6% from the peak.
The Case-Shiller Index uses the “sales pairs” method, comparing sales in the current month to when the same houses sold previously. The price changes within each sales pair are integrated into the index for the metro, and adjustments are made for home improvements and other factors (methodology). By tracking the change in dollars needed to buy the same house over time, the index is a measure of house price inflation.
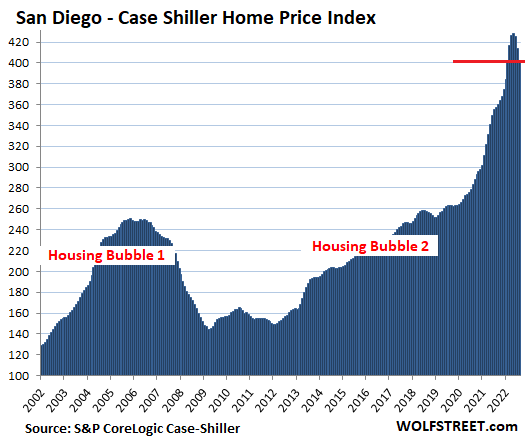
In the San Diego metro, house prices fell 2.8% in August, the biggest month-to-month drop since Housing Bust 1, after the 2.5% drop in July, and the 0.7% drop in June, to the lowest level since January.
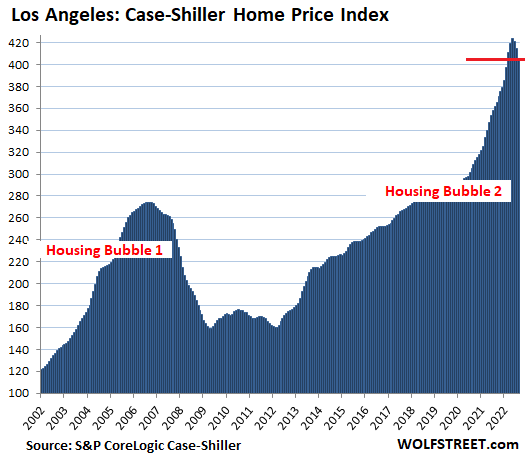
In the Los Angeles metro, house prices fell 2.3% in August from July, the steepest drop since Housing Bust 1, after having dropped 1.6% in July, and 0.4% in June. This slashed the year-over-year price gain to +12.1%, from +23% a few months ago. The index is down 4.3% from the peak.
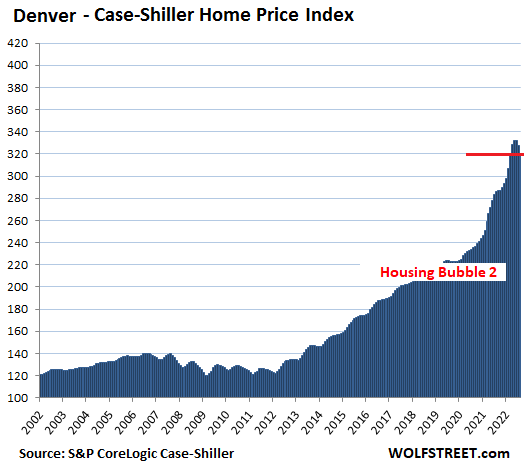
In the Denver metro, house prices dropped 2.3% in August from July – the second steepest drop on record after January 2009 – following the 1.4% drop in July, and the 0.1% dip in June.
The index has dropped 3.7% from the peak, cutting the year-over-year gain in half, to 12.0%.
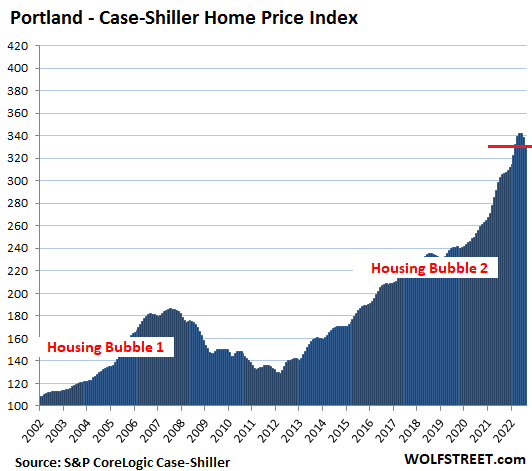
In the Portland metro, house prices dropped 1.9% in August, after the 1.1% drop in July, and the 0.1% dip in June, following a ridiculous spike.
The index has dropped 3.1% from the peak, cutting the year-over-year gain to +8.6%, from +19% earlier this year.
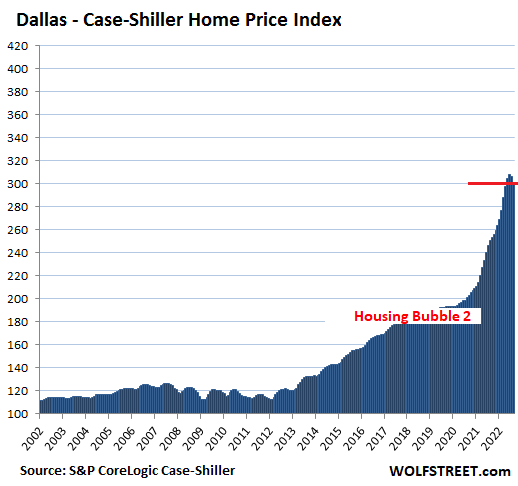
In the Dallas metro:
- Month over month: -1.9%, after the -0.4% dip in July.
- Year over year: +20.2%, down from +30% earlier this year.
- From the peak: -2.3%.
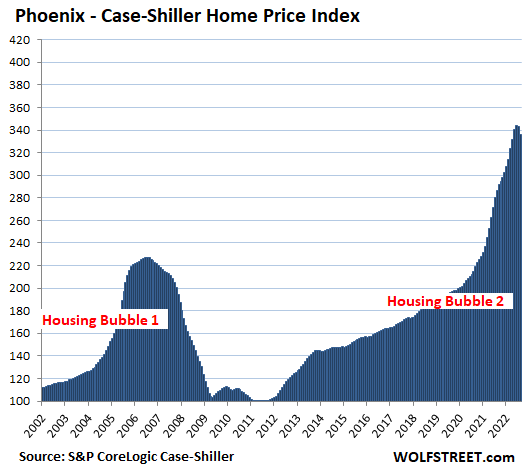
In the Phoenix metro:
- Month over month: -2.1% after -0.2% in July.
- Year over year: +17.1%, down from +32% earlier this year.
- From the peak: -2.3%.
- Month over month: -15%, after the 0.7% dip in July.
- Year over year: +7.4%, down from +13% earlier this year.
- From the peak: -2.2%.
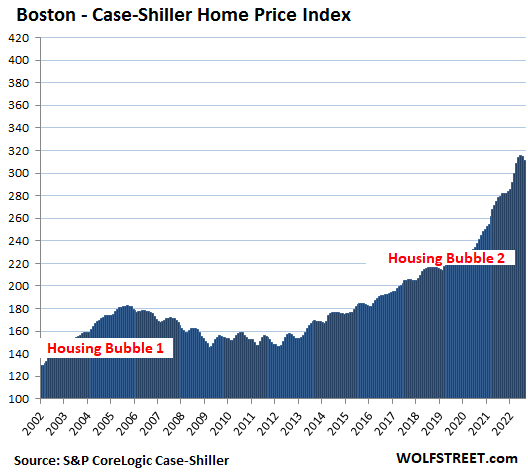
In the Boston metro:
- Month over month: -1.2% after -0.3% in July.
- Year over year: 11.4% from +15% earlier this year.
- From the peak: -1.5%.
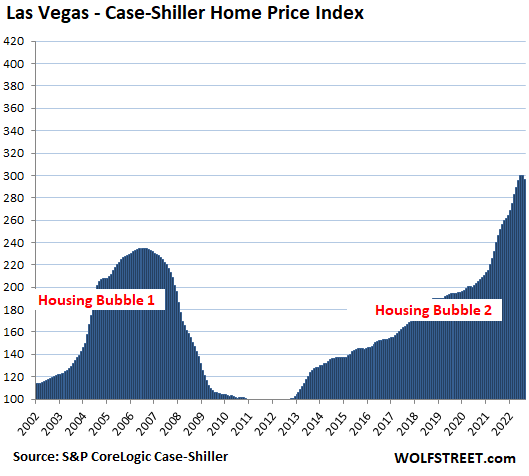
Las Vegas metro:
- Month over month: -1.3% from the record in July.
- Year over year: +17.5%, down from +28% earlier this year.
- From the peak: -1.3%.
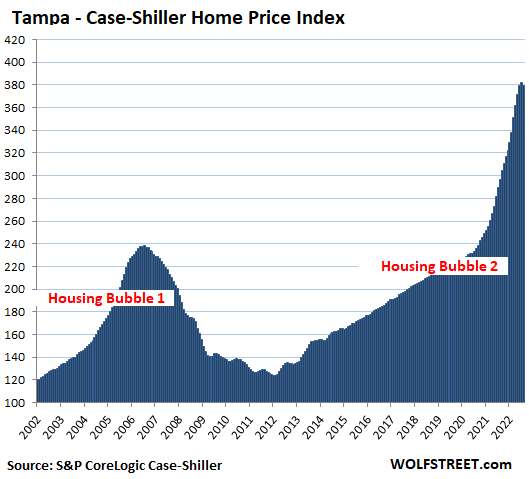
Tampa metro:
- Month over month: -0.5% from record in July
- Year over year: +28.0%, down from +36% earlier this year
- From peak: -0.5%
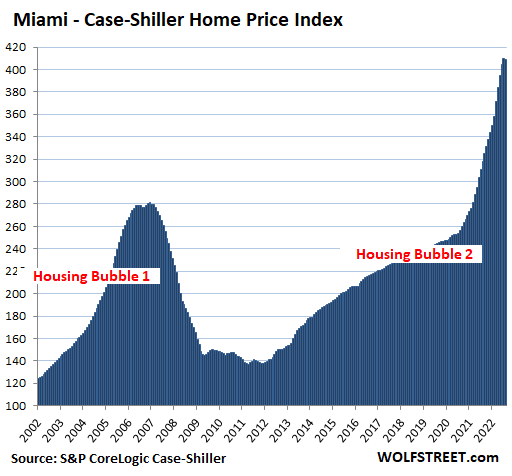
Miami metro:
- Month over month: -0.1% from record in July.
- Year over year: +28.6%, down from +34% earlier this year.
- From peak: -0.1%.
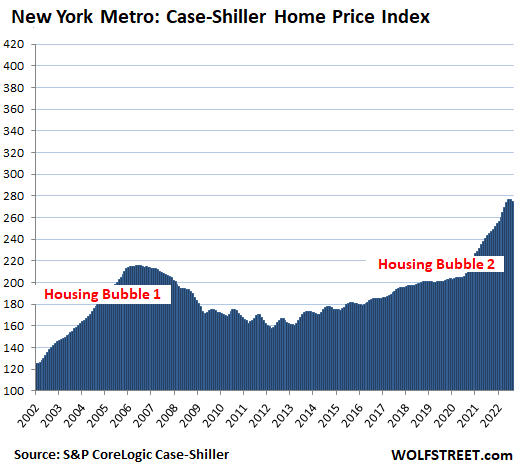
In the New York metro:
- Month over month: -0.5% from record in July
- Year over year: +12.3%, down from +15% earlier this year
- From peak: -0.5%
No comments:
Post a Comment
Note: Only a member of this blog may post a comment.