SOURCE:
Services Inflation Spikes, Core CPI Jumps, Food Inflation Worst since 1979, Durable Goods Rise, but Gasoline & Airfares Plunge
An ugly CPI print of inflation that’s entrenched and getting worse in vast parts of the economy. The Fed will have a heck of a time cracking down on it.
Gasoline prices plunged, but food prices jumped, prices of durable goods rose again, “core CPI,” which excludes food and energy, jumped, and prices of services spiked relentlessly as inflation has shifted from supply-chain issues and commodities to services.
This process of inflation muscling into services started a year ago and has been getting worse every month for the 12th month in a row, a clear sign that inflation has gotten solidly entrenched, and is getting worse in vast parts of the economy, and that the Fed will have a hard time dislodging it.
Overall inflation as measured by the year-over-year Consumer Price Index (CPI-U), released today by the Bureau of Labor Statistics, backed off a wee bit, but not nearly as much as expected, to 8.3% in August, from 8.5% in July, and remained in the ugly zone. On a month-to-month basis, CPI rose 0.1%, up from a 0% rise in July.
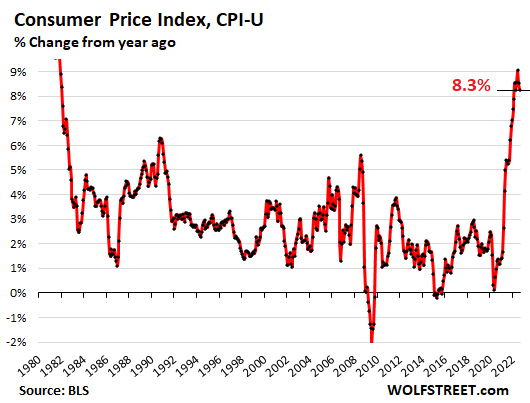
Social Security COLA for 2023 will be near 8.9%, one more reading to go.
The Consumer Price Index for “all urban wage earners & clerical workers” (CPI-W) backed off to 8.7%, from July’s 9.1%. The average year-over-year rates in July (9.1%), August (8.7%), and September (x%) will determine the COLAs for Social Security benefits in 2023. The two-month average is 8.9%. September’s CPI is going to be roughly in the same range, and the COLA for 2023 will be in the 8.9% range, up or down a little.
Services Inflation spikes straight up.
The CPI for services spiked relentlessly, jumping by 0.6% in August from July and by 6.8% year-over-year, the worst increase since October 1982. This is now the driver of inflation, it’s a huge part of the economy, and it includes the housing components of CPI, and it’s a nightmare.
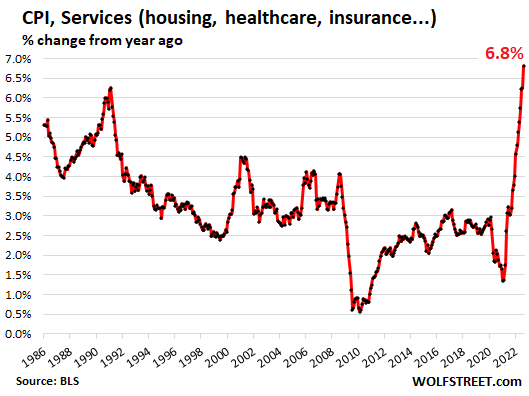
Many services have little or no contact with commodities: Insurance, rent-based factors, education, healthcare, etc. Only a few services are impacted by commodities, especially fuel costs: airfares, other transportation services, utility services, etc. And that’s why a decline in commodities prices has little impact on services. Services inflation is the worst kind of inflation.
Service categories where CPI rose year-to-year.
These are the categories with year-over-year increases. Within them are some categories with month-to-month declines, such as delivery services and airline fares, which may indicate that inflation is shifting to categories that now have big month-to-month increases, such as health insurance, vehicle insurance, and vehicle maintenance. More on housing inflation in a moment:
Service categories where CPI fell year-over-year:
“Core” CPI.
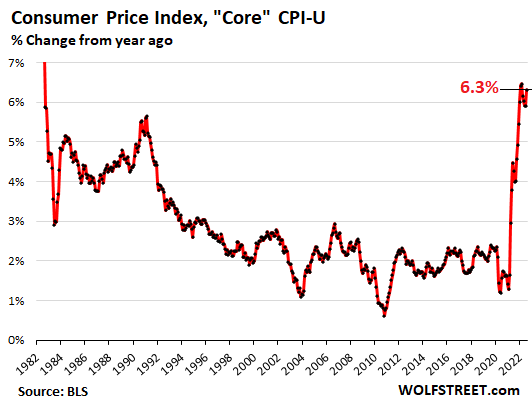
The “core” CPI, which excludes the volatile commodities-dependent food and energy components, jumped to 6.3% on a year-over-year basis, and to 0.6% on a monthly basis. This index is design to measure inflation in the broader economy, and it will give the Fed the willies:
Food inflation worst since 1979, moving from category to category.
The CPI for “food at home” – food bought in stores and at markets – spiked by 13.5% year-over-year, the worst since February 1979. On a month-to-month basis, prices jumped by 0.7%.
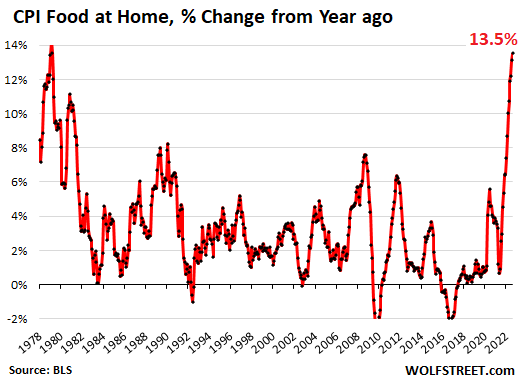
Food inflation hits lower-income consumers the most because they spend a bigger part of their budget on food. Food inflation, along with housing cost inflation, are brutal for them.
Inflation cycles from category to category, letting up in some categories, and heating up in others, and you can see the shifting dynamics in the table below:
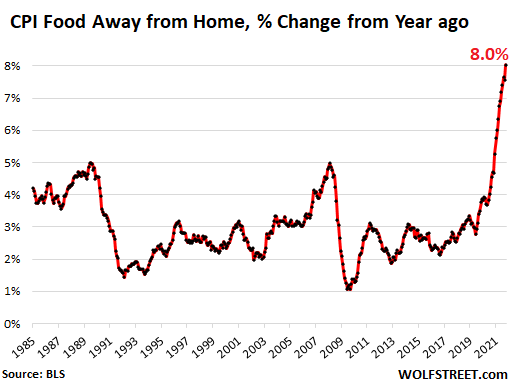
“Food away from home” CPI – restaurants, vending machines, cafeterias, sandwich shops, etc. – jumped by 8.0% year-over-year, the worst since 1981, and by 0.9% in August from July.
Within this category: Food at employee sites and schools spiked by 19.7% in August from July, which brought the year-over-year spike to 23.7%.
Energy plunged from July, but still up hugely year-over-year.
The Energy CPI plunged by 5.0% in August from July, on plunging gasoline prices. But natural gas prices have resumed their rise, and electricity prices have never slowed their rise:
Housing costs surge: part of services CPI.
The CPI for “rent of shelter” accounts for 31.9% of total CPI. It measures housing costs as a service – “shelter” – not as an investment asset to be purchased. Its major components:
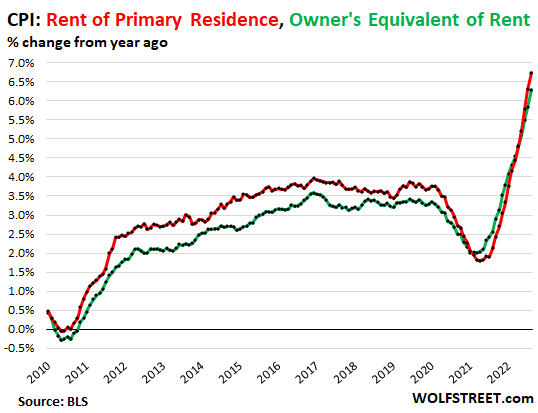
“Rent of primary residence” (accounts for 7.2% of total CPI) jumped by 0.7% in August from July, and by 6.7% year-over-year (red in the chart below). It’s based on actual rents paid by a large panel of tenants, including in rent-controlled apartments.
“Owner’s equivalent rent of residences” (accounts for 23.7% of total CPI) jumped by 0.7% for the month and by 6.3% year-over-year (green line). It measures the costs of homeownership as a service, based on what a large panel of homeowners report their home would rent for.
Both measures are still below overall CPI and are therefore still holding down overall CPI, but are holding it down less each month. And this is where a big part of the action is, going forward:
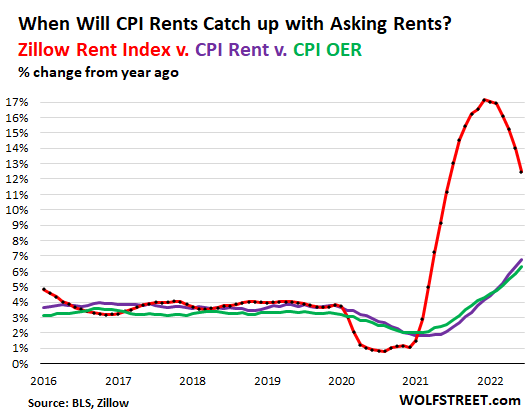
The “Zillow Observed Rent Index” (ZORI) reflects “asking rents” (advertised rents of apartments and houses listed for rent).
In August, the ZORI jumped by 0.6% from July, and by 12.5% year-over-year, to a record of $2,090. But those jumps were smaller than the prior month-to-month and year-over-year spikes, showing that rental inflation is somewhat less brutal than before, but still brutal.
Asking rents (red line) feed only gradually into actual “rents” paid and reported by tenants (purple line) and into “owner’s equivalent rent” as estimated by homeowners (green).
I discussed this lag and what it means for CPI in 2023 here. It’s pretty clear from the chart what this will mean for CPI in 2023, regardless of what asking rents will be doing by then:
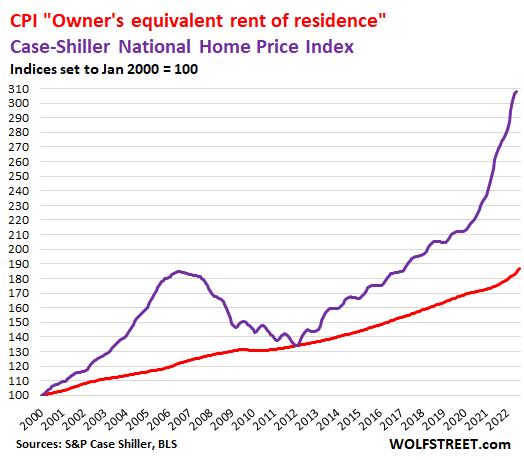
Home prices spiked by 18.0% year-over-year, according to the Case-Shiller Home Price Index (purple line below). The index lags reality on the ground by four to six months, but the first declines are just now cropping up in some markets, as documented in The Most Splendid Housing Bubbles in America:
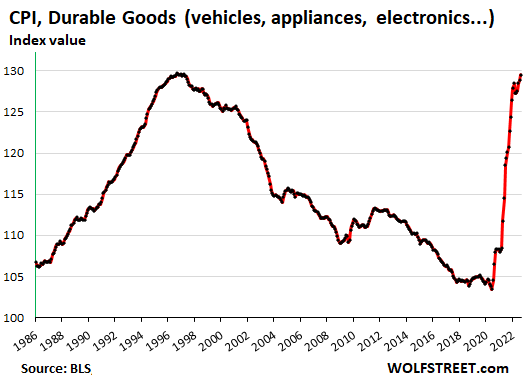
Durable goods CPI.
Surprisingly, the CPI for durable goods keeps rising, and rose 0.5% in August from July, the fifth month in a row of month-to-month increases, when durable goods prices had been expected to come down from the mega-demand-meets-supply-chain-chaos spike during the pandemic. But they’re not coming down; they’re still increasing but at a slower rate.
Durable goods include motor vehicles, appliances, furniture, consumer electronics, sporting goods, etc.
Inflation is supposed to measure how many dollars you have to pay for the same thing over time. But if the product is improved – more powerful, faster, more features, better safety, better fuel economy, more memory, faster processors, etc., “hedonic quality adjustments” remove the costs of those added improvements, with the result that many durable goods have negative CPI rates over the years.
Consumer electronics almost always have a large negative CPI. This makes sense as manufacturing constantly gets more efficient, lowering the costs of products, and only the added improvements cause prices to rise or, in many cases, drop more slowly, such as with laptops. This is a type of “deflation” that is natural and beneficial and should not worry anyone.
But these are not normal times, and the price spikes in new and used vehicles have by far out-powered any hedonic quality adjustments.
As index value: This chart of durable goods CPI as index values shows the long-term decline caused by hedonic quality adjustments and actual price declines (i.e. of laptops), and the current spike, and how prices are still rising but at a slower pace than 10 months ago:
Year-over-year, the CPI for durable goods increased by 7.8%, which is down a lot from the 18% range where it had been late last year and early this year, but still a huge increase.
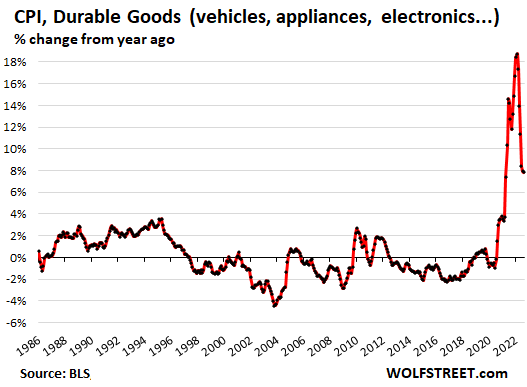
Note the decline in information technology products, which is typical and has been similar before the pandemic:
No comments:
Post a Comment
Note: Only a member of this blog may post a comment.